Machine learning / Data analysis

Car Price Prediction

An explainable path from car features to price.

A reproducible regression study exploring how engine size, horsepower, mileage, fuel type, and brand relate to a generated car price.

  • Python
  • pandas
  • scikit-learn
  • Matplotlib
  • Jupyter
Academic study · synthetic data
Comic illustration of a data analyst exploring vehicle features
Concept illustration of the project workflow. The artwork explains the idea rather than reproducing the application interface or measured results.
10,000synthetic records
£1,490.78saved test-set RMSE
0.9907saved test-set R²
The project in brief

Problem. Solution. Evidence.

The problem
Mixed numerical and categorical features need a reproducible modelling workflow.
My solution
I used a preprocessing pipeline, a reserved test split, and cross-validation to evaluate a linear model.
The evidence
Saved notebook outputs report test RMSE £1,490.78 and R² 0.9907 on synthetic data. The tuned model matched the baseline; these are not real-market accuracy claims.
The story behind the project

From vehicle features to an evaluated model.

Scroll through four steps. Concept illustrations explain the workflow; they are not application screenshots or measured charts.

Comic illustration of a data analyst exploring vehicle features
01 / 04Explore the features
01 / Explore the features

Understand what the data represents.

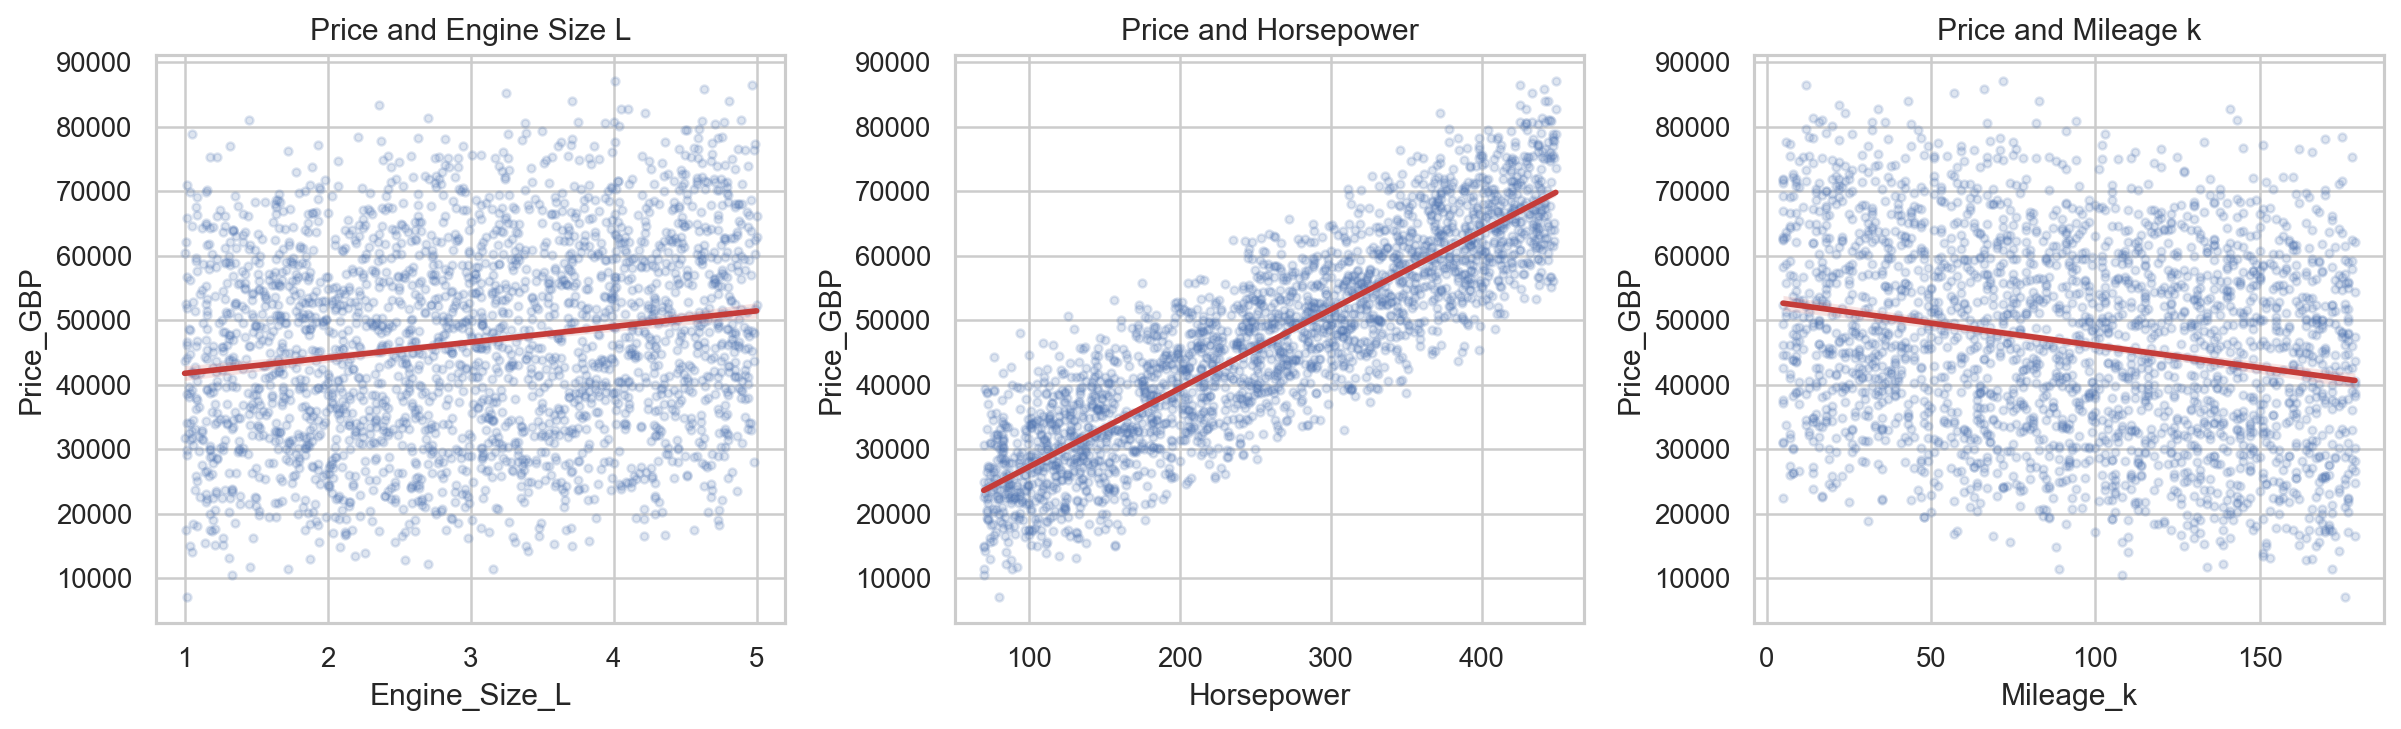
The study generates 10,000 synthetic car records using a fixed random seed. Exploratory analysis looks at engine size, horsepower, mileage, fuel type, and brand before modelling.

Synthetic data, with reproducible assumptions.Comic illustration of a data analyst exploring vehicle features

02 / Reserve the test set

Keep evaluation data separate.

A reproducible 70/30 split sets aside test records before model selection. Cross-validation uses only the training portion, keeping the final test set outside the tuning process.

Seven parts for training. Three for testing.Comic illustration of a data analyst separating training and evaluation records

03 / Preprocess and fit

Build one repeatable pipeline.

Numerical features are standardised and categories are one-hot encoded. A scikit-learn pipeline fits a linear regression model; five-fold cross-validation compares parameter settings on training data.

Preprocessing stays inside the modelling pipeline.Comic illustration of a data analyst building a modelling pipeline

04 / Inspect the errors

Look beyond a single score.

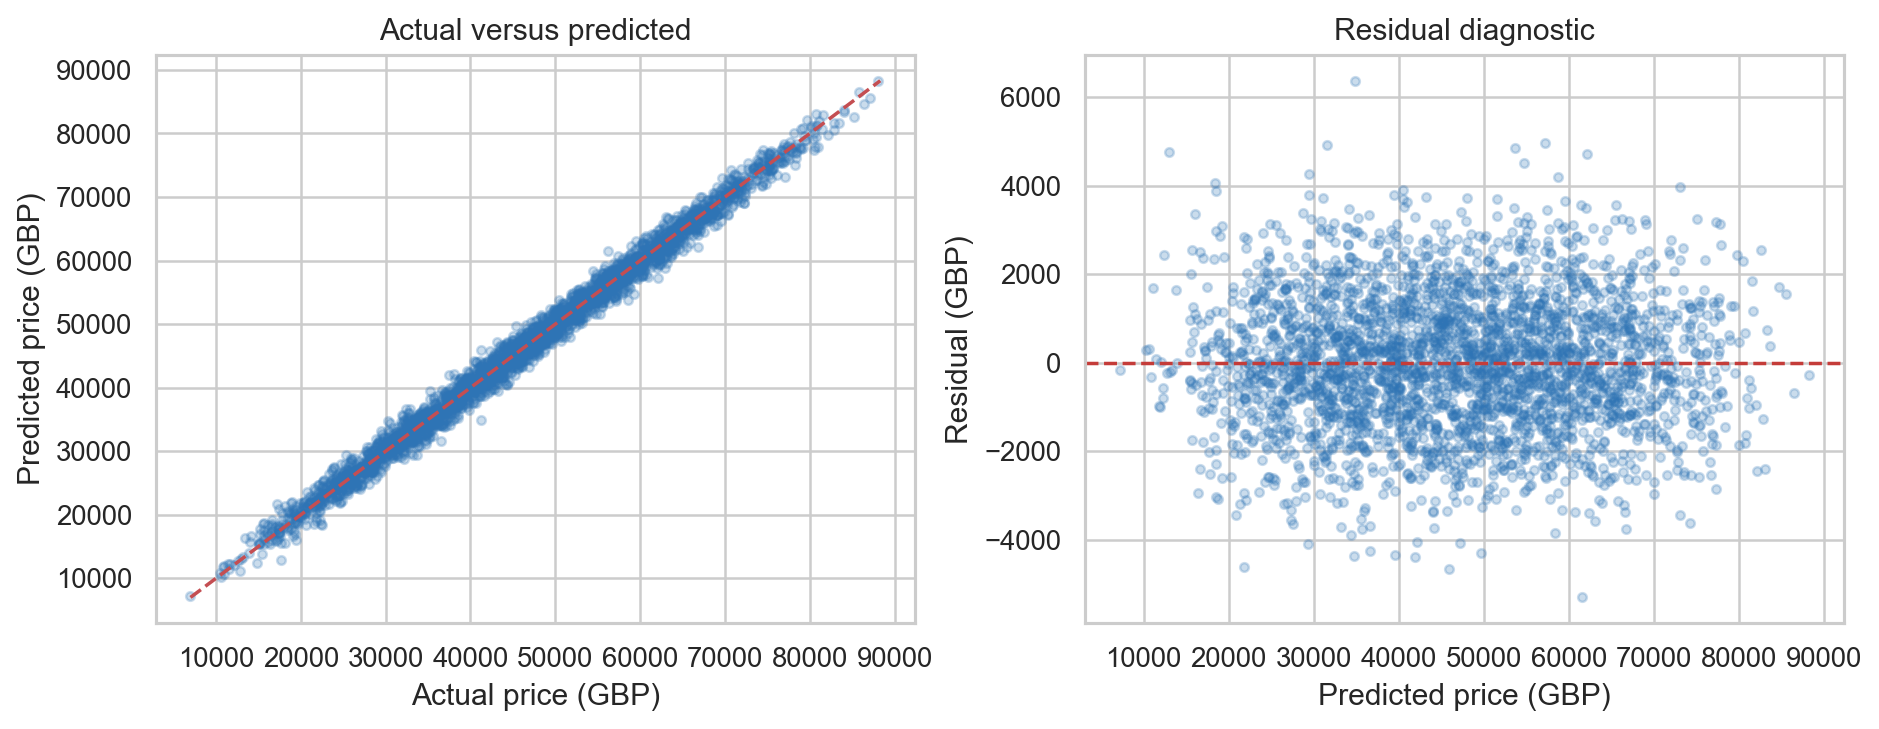
Saved notebook outputs report test RMSE £1,490.78 and R² 0.9907. Predicted-value and residual plots help inspect errors. The tuned model matches the baseline, and synthetic-data results do not establish accuracy on real listings.

Evaluate the result within its limits.Comic illustration of an analyst inspecting illustrative prediction and residual plots

The problem

Understand the data.

The task is to build and evaluate a price predictor while handling both numerical and categorical features. The project follows the full analysis path: generate data, explore relationships, preprocess inputs, fit a model, and inspect errors.

Analysis workflow
  1. 01Explore
  2. 02Split 70 / 30
  3. 03Preprocess
  4. 04Fit & evaluate
Inside the project

What the implementation does.

01

A reproducible dataset

A fixed random seed generates 10,000 records. Price combines numerical contributions, fuel and brand factors, and Gaussian noise.

02

Preprocessing inside the pipeline

Numerical inputs are standardised and categories are one-hot encoded. A ColumnTransformer and Pipeline keep fitted preprocessing within training and cross-validation.

03

Evaluation beyond a single score

The notebook records MSE, RMSE, and R², compares baseline and tuned models, and visualises predicted values and residuals.

View the original analysis figures

These are saved project report figures using synthetic data, separate from the conceptual illustrations above.

Original synthetic car price predictions and residual plotOriginal exploratory feature charts
A technical decision

Keep the test set outside model selection.

A reproducible 70/30 split reserves test records. GridSearchCV uses five-fold cross-validation on training data to compare intercept and positive-coefficient settings. The saved results show the selected model matches the baseline rather than improving it.

Scope & reflection

What this demonstrates.

The target was generated using a largely linear formula, so a strong linear-regression fit is expected. These saved notebook results demonstrate the modelling workflow, not accuracy on real used-car listings. The notebook was inspected, not retrained during this portfolio update.

A useful next step

Evaluate on independently sourced real listings, inspect data leakage and market differences, and compare against a simple baseline before making real valuation claims.

Metrics transcribed from saved notebook outputs; charts copied from the existing report assets.

Next projectClearFlow